Explainable AI for Maintenance Decisions: Why a Prediction Isn't Enough for a Planner to Act On
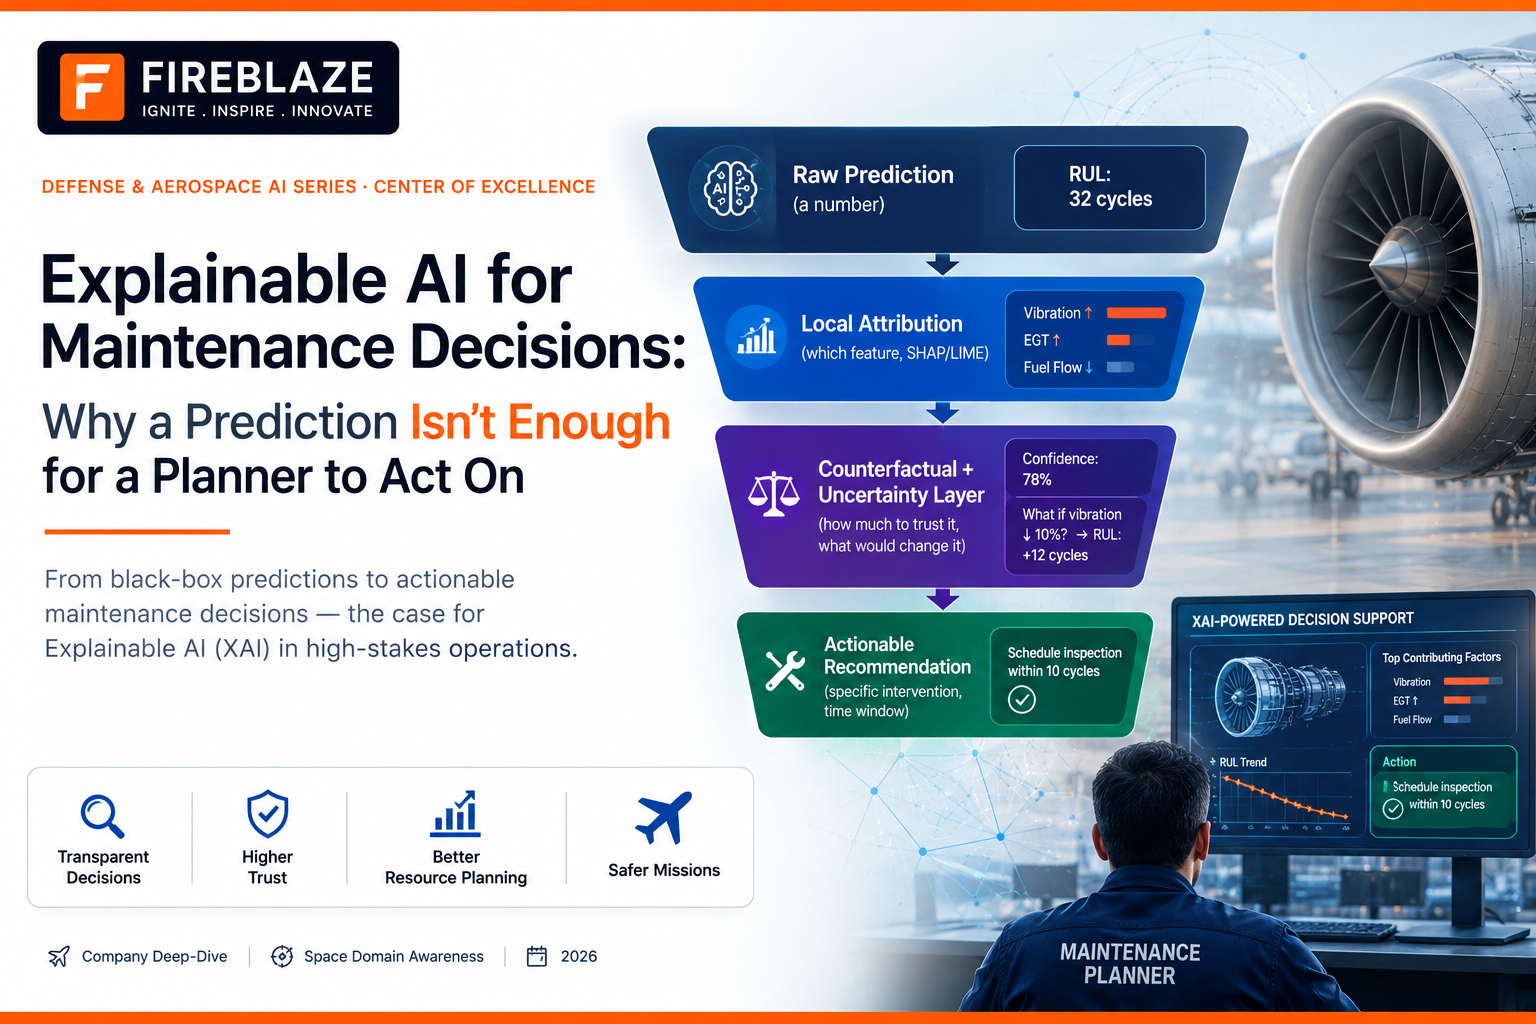
Explainable AI for Maintenance Decisions: Why a Prediction Isn't Enough for a Planner to Act On
A domain-knowledge piece on the gap between "the model says 87%" and "here's what you should actually do about it" — written for anyone building or evaluating a predictive maintenance system that a human is expected to act on, not just monitor.
1. Hook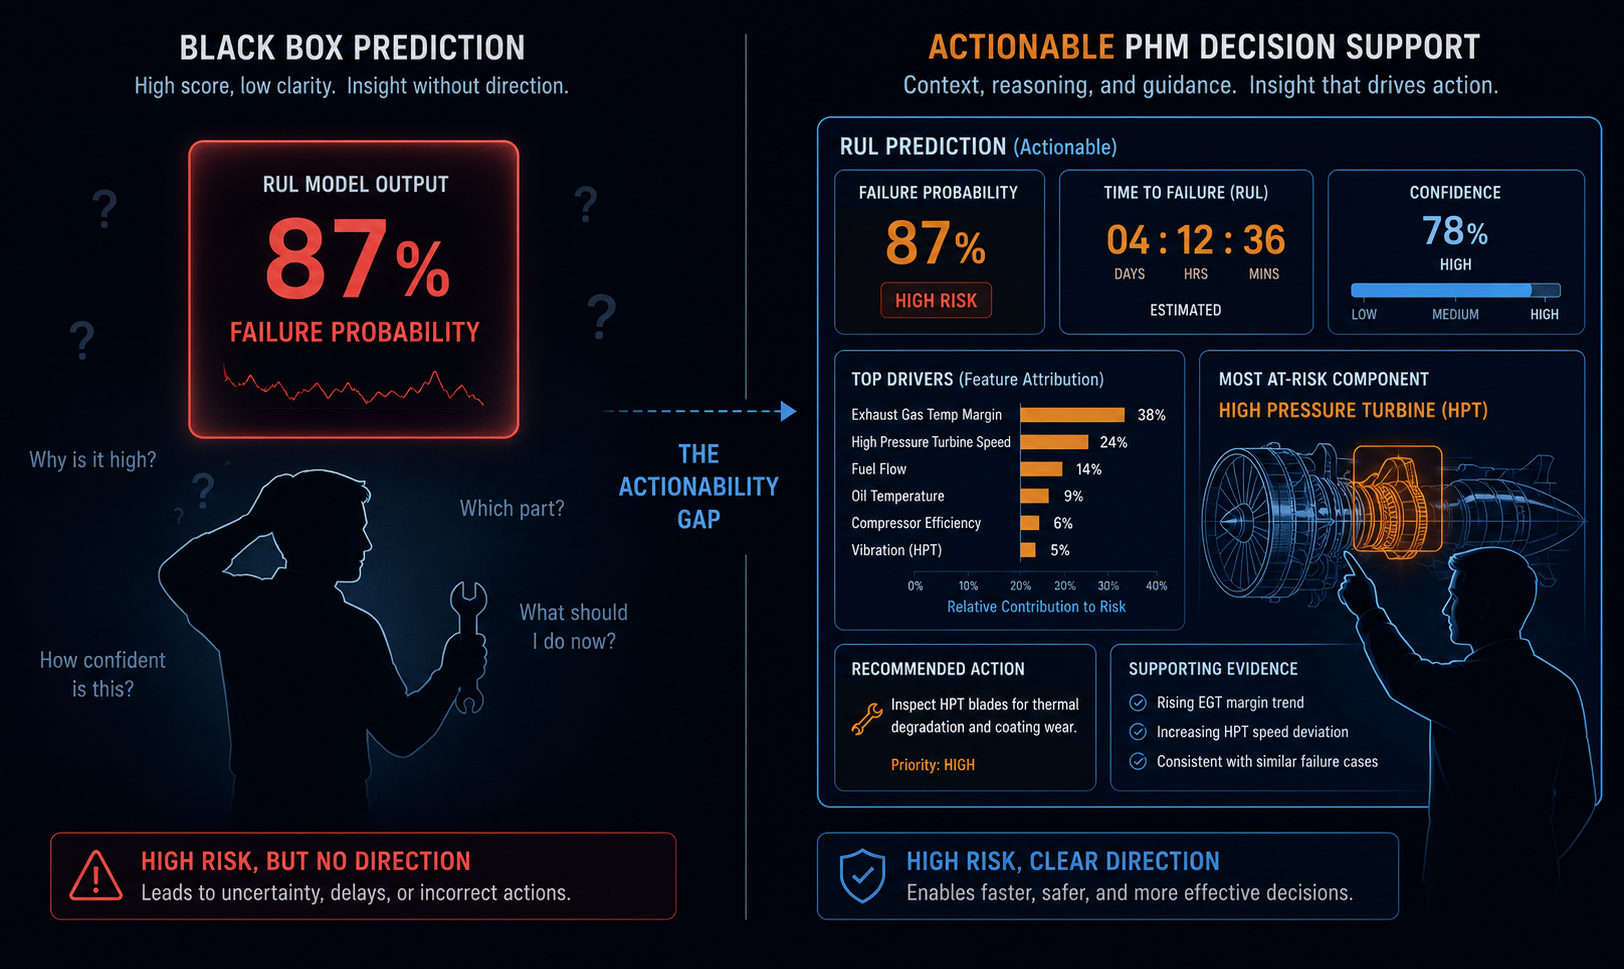
Most predictive maintenance pitches lead with a number: "our model predicts component failure with 94% accuracy." It's the easiest thing to benchmark and the easiest thing to put on a slide. But hand that number to an actual maintenance planner — someone who has to decide, this week, whether to pull an aircraft off the schedule, order a part, or wait one more sortie — and the number alone answers almost none of the questions that decision actually depends on: which component, how confident should I be, how long do I have, and why should I trust this over my own judgment and the last three false alarms this system gave me. A prediction is a statement about probability. A maintenance decision is a commitment of money, downtime, and risk. Explainable AI (XAI) exists to close that gap — but most XAI work stops at "here's which features mattered," which is necessary and nowhere near sufficient. This piece is about what actually needs to sit between a model's output and a planner's action.
2. Core Explanation
2.1 Restating the Actual Problem
A predictive maintenance model — whether it's outputting a remaining-useful-life (RUL) estimate, a binary failure-within-N-cycles flag, or an anomaly score — is solving a prediction problem. A maintenance planner is solving a decision problem, and that decision has a specific, recurring shape regardless of the platform or industry:
- Which asset, and which component on it, is actually at risk? Not "the engine," but which specific subsystem or sensor pattern is driving the concern.
- How urgent is this, concretely? Not a probability, but a usable time window — days, flight hours, or cycles — within which action is needed.
- How much should I trust this particular prediction, right now? Not the model's average historical accuracy, but a case-specific confidence signal, because a planner who's been burned by false alarms will not act on a model's aggregate track record alone.
- What intervention would actually change the outcome? Not just "risk is high," but which corrective action — inspection, part replacement, derating, schedule change — is expected to reduce that risk, and by how much.
A raw prediction answers none of these directly. Everything discussed below is best understood as a set of techniques for constructing answers to these four questions on top of a model that was never designed to answer them natively.
2.2 The XAI Toolbox, and What Each Piece Actually Tells You
The XAI literature applied to predictive maintenance has converged on a fairly consistent toolkit, but the methods answer meaningfully different questions, and conflating them is the single most common mistake in how they get deployed.
- Global feature attribution (SHAP, DeepSHAP) answers "across many predictions, which features generally drive this model's outputs" — useful for validating that a model has learned physically sensible relationships (e.g., that bearing temperature and vibration amplitude dominate over an irrelevant sensor), but it describes the model's general behavior, not the specific case in front of a planner today.
- Local feature attribution (SHAP applied per-instance, LIME, DeepLIFT) answers "for this specific prediction, which input values pushed the output up or down, and by how much" — this is the layer most XAI-for-PdM papers actually mean when they say "explainable," and it's the minimum needed to answer question 1 above (which component, via which signal).
- CXplain and other causal-attribution-flavored methods attempt to go a step further, estimating each input's causal contribution to the prediction rather than a purely correlational attribution — a meaningfully different (and harder) claim than what SHAP or LIME provide, and one worth being skeptical of unless the underlying causal assumptions are explicitly stated.
- Counterfactual explanations (CFEs) answer a different question entirely: "what would need to change, and by how much, for the prediction to flip to a safer outcome" — this is the layer that most directly maps onto question 4 (what intervention would help), because it's phrased in the language of action rather than attribution.
- Partial Dependence Plots (PDPs) show how the prediction changes as one feature varies while others are held constant, averaged across the dataset — useful for engineering validation and model debugging, but again a global, not case-specific, view.
| Method | Question It Answers | Scope | Directly Actionable? |
|---|---|---|---|
| SHAP (global) | Which features matter overall, across the model | Model-level | No — validates the model, doesn't drive a decision |
| SHAP / LIME (local) | Which features drove this prediction | Instance-level | Partially — identifies the "which," not the "what to do" |
| DeepSHAP / DeepLIFT | Local attribution for deep/neural architectures specifically | Instance-level | Partially, same limitation as above |
| CXplain | Estimated causal (not just correlational) contribution per feature | Instance-level | Partially — stronger claim, but assumption-dependent |
| Counterfactual explanations | What would need to change to flip the outcome | Instance-level | Yes — phrased directly as an intervention |
| Partial Dependence Plots | How the prediction responds to one feature, on average | Model-level | No — a validation and debugging tool, not a decision aid |
The practical implication: a system that only surfaces SHAP values and calls itself "explainable" has answered question 1 and stopped there. It has told the planner which sensor looked bad, not how urgent this is, how much to trust it, or what to do about it — which is precisely the gap named in this piece's title.
2.3 Why Attribution Alone Isn't a Decision
Consider the most common failure pattern in deployed XAI-for-PdM systems: a dashboard shows a risk score and a SHAP bar chart underneath it — "vibration_rms contributed +0.31, temperature_delta contributed +0.18." This is genuinely useful information, and it is also, on its own, not something a planner can act on with confidence, for three concrete reasons:
- Attribution is not the same as intervenability. Knowing that "vibration_rms" drove the prediction doesn't tell you whether that vibration signature is something a scheduled inspection can catch, whether it requires an immediate grounding, or whether it's a known benign pattern the model hasn't been trained to distinguish from a genuine precursor. The feature that matters most statistically is not automatically the feature that matters most operationally.
- Attribution says nothing about confidence in this specific case. A model can be highly confident and wrong, or tentative and right, and standard attribution methods don't distinguish between "this pattern closely resembles training data the model has seen many times" and "this pattern is somewhat novel and the model is extrapolating." Without an explicit uncertainty signal, a planner has no principled way to calibrate trust case by case — which is exactly the standardized-evaluation gap several recent XAI-for-PdM review frameworks (including proposed "Explainability Parameters," or XPA, evaluation schemes) have specifically been built to address, alongside fidelity, stability, and comprehensibility as separate, explicitly measured axes.
- Attribution doesn't map to a time window. A feature contributing strongly to a failure prediction says nothing about whether the relevant failure mode plays out over the next flight hour or the next six months — and a planner's entire scheduling decision hinges on that window, not on the feature's statistical weight.
2.4 Counterfactuals: The Layer That Actually Speaks the Planner's Language
Counterfactual explanations (CFEs) are worth treating as a distinct, higher-value layer rather than a variant of feature attribution, because they're structurally phrased as interventions rather than diagnoses. A local SHAP explanation says "temperature_delta contributed +0.18 to this failure prediction." A counterfactual explanation says something closer to "if temperature_delta had stayed below 12°C over the last three cycles, the failure probability would have dropped from 87% to 22%." The second statement is directly usable by a planner or an engineer deciding whether a specific corrective action — better cooling, a derated operating profile, an earlier inspection — is worth doing, because it's phrased in terms of a controllable variable and a quantified outcome change, not just a correlation strength.
This distinction matters enough that recent standardized-evaluation work on XAI for predictive maintenance has explicitly paired SHAP-based attribution with counterfactual scenario generation as complementary layers — one for diagnosing what the model saw, the other for exploring what could be done about it — rather than treating either as sufficient alone.
2.5 Uncertainty Is Not Optional
A recommendation this piece treats as close to non-negotiable: any maintenance-facing AI system should surface a case-specific confidence or uncertainty signal alongside its prediction and its attribution, not just a point estimate. Options range in complexity — from simple prediction intervals around an RUL estimate, to Bayesian or ensemble-based uncertainty decomposition (separating "the model is unsure because the data is genuinely noisy" from "the model is unsure because this input looks unlike anything in training"), to conformal-prediction-style calibrated intervals with formal coverage guarantees. Whichever approach is used, the operational point is the same: a planner who has been given only a point prediction has no principled basis for deciding when to override the model versus when to trust it, and will — reasonably — either over-trust it (acting on noise) or under-trust it (ignoring a genuine signal) depending on how the last few predictions happened to play out, rather than on any systematic basis.
2.6 A Framework for What "Actionable" Should Actually Mean
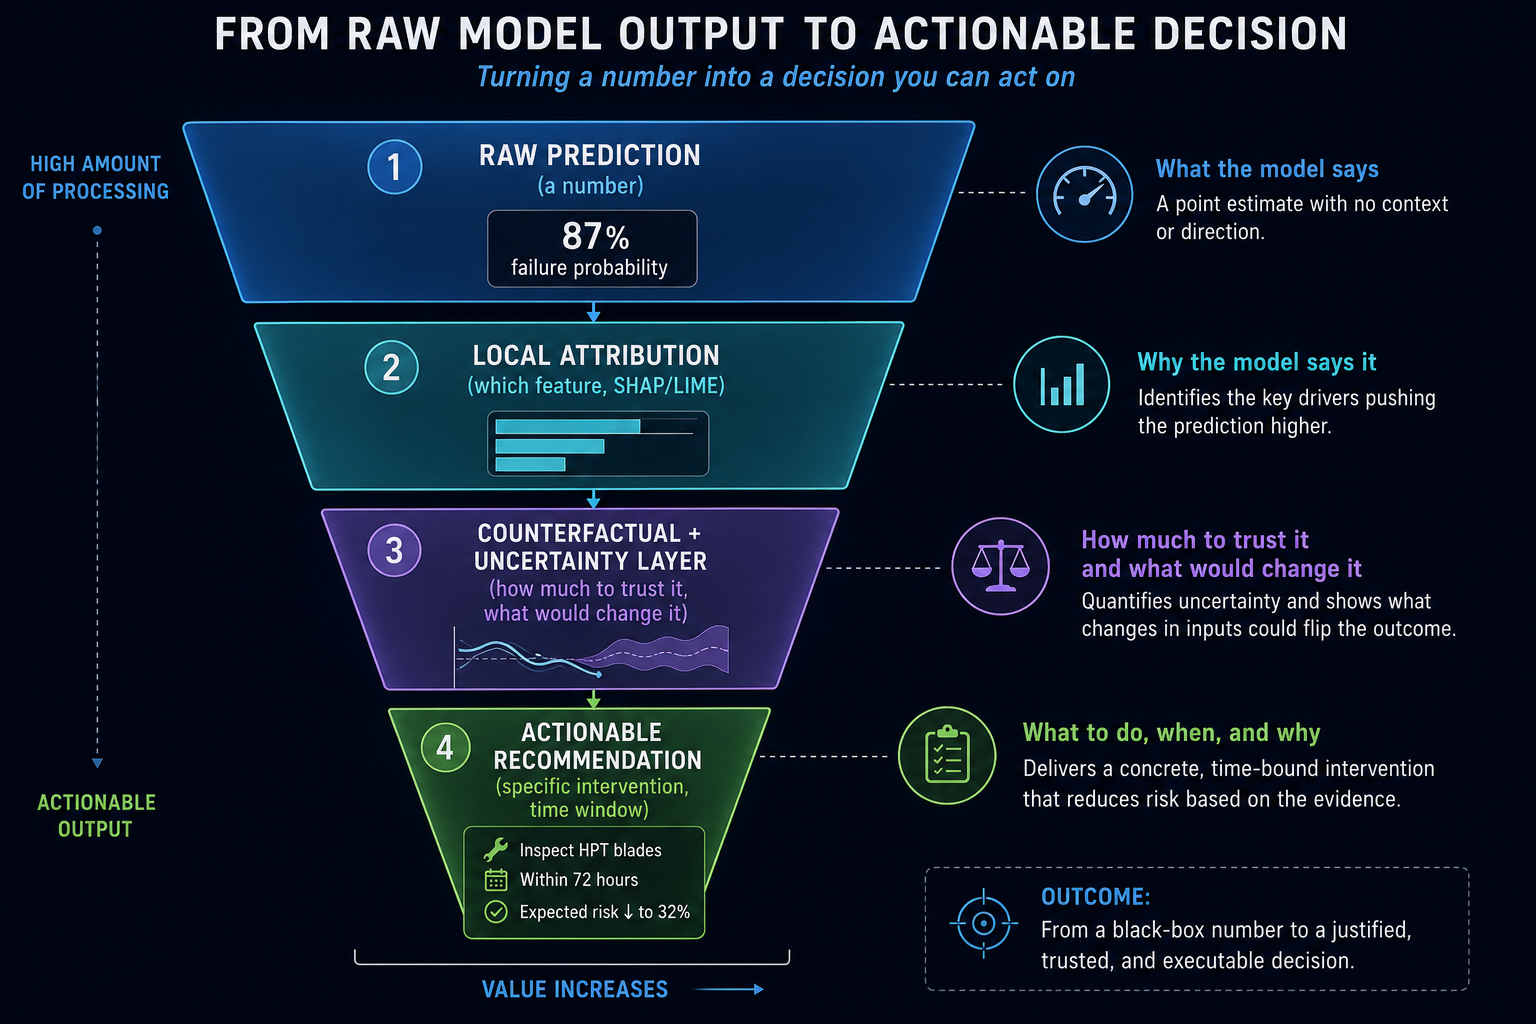
Pulling the pieces above together, a maintenance-facing explanation layer that's actually built for a planner to act on should aim to answer all four of Section 2.1's questions, not just the first one:
| Planner's Question | What Answers It | XAI/ML Layer Required |
|---|---|---|
| Which component is at risk? | Local feature attribution, mapped to a named physical subsystem | SHAP / LIME / DeepSHAP, with a feature-to-component mapping layer |
| How urgent is this? | A quantified time window, not just a probability | Time-to-event modeling (e.g., RUL regression) paired with the prediction |
| How much should I trust it? | A case-specific confidence or uncertainty band | Conformal prediction, Bayesian uncertainty, or ensemble disagreement |
| What should I actually do? | A ranked set of interventions and their expected effect on risk | Counterfactual explanations, ideally validated against domain constraints |
Notably, none of these four rows is answered by model accuracy alone, and no single technique answers more than one row well — which is the core argument of this piece: "explainable" maintenance AI is a multi-layer construction problem, not a single library call.
2.7 Common Pitfalls
- Treating a SHAP value as a causal claim. SHAP (and LIME) attribute predictive contribution under the model's learned correlations, not necessarily a real-world causal mechanism — a feature can be highly attributed because it's a strong proxy for the true cause, not the cause itself. Presenting attribution output with causal-sounding language ("this caused the failure risk") overstates what the method actually established, unless a causal-attribution method with explicit assumptions (like CXplain) has been used and those assumptions checked.
- Explanation instability across retraining. Attribution rankings can shift meaningfully between model versions even when overall accuracy barely changes, which is disorienting for planners who've built trust around a specific explanation pattern — a reason several proposed evaluation frameworks explicitly score "stability" as its own axis, separate from accuracy or fidelity.
- Confusing global validation with local decision support. A well-behaved global SHAP summary plot (proving the model relies on physically sensible features overall) is a model-validation artifact for engineers, not a decision aid for a planner looking at one specific asset today — the two should not be presented on the same dashboard as if they answer the same question.
- Shipping attribution without a time window or uncertainty band. As covered in Sections 2.3 and 2.5, this is the single most common gap between a published "explainable PdM" research system and something a planner could genuinely act on operationally.
- Assuming the planner wants more explanation, not less. Beyond a certain point, additional detail (more features, deeper SHAP breakdowns, longer counterfactual scenario lists) can overwhelm rather than clarify — the comprehensibility axis in frameworks like XPA exists specifically because "more explainable" and "more explanation" are not the same thing, and usability testing with actual planners, not just technical validation, is necessary to find that point.
3. Worked Example / Analogy
Imagine two versions of a doctor's visit. In the first, the doctor runs a test and says: "There's an 87% chance something is wrong with your heart." That's a prediction. It's alarming, and it's also nearly useless on its own — you don't know which part of the heart, whether it's urgent enough to act on today or something to monitor over months, how much to trust this particular test given the doctor's track record of false alarms, or what you could actually do differently to change the outcome.
Now imagine the second version: "Your ECG shows an irregular pattern specifically in the electrical signal between these two chambers — that's what's driving the concern, not your cholesterol or your weight, which both look fine. Based on how this pattern typically progresses, you likely have two to six weeks before it becomes urgent, not two days. I'm moderately confident in this reading — it's a clear enough signal, though not one I've seen as often as more common patterns, so I'd want a specialist to confirm before you make any big decisions. If you reduced your sodium intake and we adjusted your current medication, our models suggest the risk would drop meaningfully — probably not to zero, but enough to justify trying that first before anything more invasive."
The second doctor hasn't just added detail for its own sake — they've answered which, how urgent, how much to trust it, and what to actually do, in that order. That's the difference this piece is describing, and it's exactly the difference between a maintenance dashboard that shows a risk score with a SHAP chart, and one that's actually built for a planner to act on.
4. Application to Defense & Aerospace
For a Defense & Aerospace AI Center of Excellence building predictive maintenance capability — whether for jet engine RUL, avionics health monitoring, or GNSS/PNT hardware degradation — the actionability gap described in this piece is not a UX nicety, it's close to a certification and operational-trust prerequisite. Military and commercial aviation maintenance decisions carry direct safety and mission-readiness consequences, and a planner (or the maintenance review board behind them) who cannot trace a recommendation back to a specific subsystem, a bounded time window, a calibrated confidence level, and a validated corrective action will — appropriately — decline to act on the model's output alone, regardless of its published accuracy figures. This is precisely why several of the more rigorous recent XAI-for-PdM frameworks explicitly pair SHAP-style attribution with counterfactual scenario generation and formal evaluation axes like fidelity, stability, and actionability, rather than treating a feature-importance chart as sufficient documentation on its own.
Practically, this should shape how a CoE evaluates or specifies any predictive maintenance system: procurement criteria and internal validation checklists should explicitly require all four layers from Section 2.6 — component-level attribution, a quantified time window, a case-specific confidence signal, and at least a preliminary counterfactual or recommended-action layer — rather than accepting a risk score and a SHAP plot as evidence of "explainability." The gap between those two things is exactly the gap between a research demo and a system a flight-line planner can actually be held accountable for using.
5. Quick-Reference Glossary
| Term | Meaning |
|---|---|
| Actionability gap | The distance between what a model's raw output (or its feature attribution) tells you and what a planner needs to know to make and justify a decision |
| SHAP (SHapley Additive exPlanations) | A feature-attribution method based on cooperative game theory, usable at both the global (model-level) and local (instance-level) scale |
| LIME (Local Interpretable Model-agnostic Explanations) | A local, model-agnostic attribution method that approximates a complex model's behavior near a specific instance with a simpler, interpretable model |
| DeepSHAP / DeepLIFT | SHAP- and attribution-style methods adapted specifically for deep neural network architectures |
| CXplain | A causal-attribution-flavored explanation method that estimates each feature's causal (not purely correlational) contribution to a prediction |
| Counterfactual explanation (CFE) | An explanation phrased as "what would need to change for the outcome to differ," directly mapping to a potential intervention |
| Partial Dependence Plot (PDP) | A global visualization showing how a prediction changes as one feature varies, averaged across the dataset |
| Uncertainty quantification | Techniques (conformal prediction, Bayesian methods, ensembles) for attaching a calibrated confidence signal to an individual prediction, not just an aggregate accuracy figure |
| XPA (Explainability Parameters) framework | A proposed standardized evaluation scheme scoring XAI methods for predictive maintenance across axes like fidelity, stability, comprehensibility, and actionability, rather than accuracy alone |