

Table of Contents
Introduction Hierarchical Clustering In Machine Learning
Hierarchical Clustering In Machine Learning is the part of the unsupervised machine learning technique that forms a cluster on the basis of similarity instance in the data point follows a series of partitions to come up with final clusters. Structure looks like a tree. There is a different type of algorithm is used like Agglomerative Clustering & Divisive Hierarchical Clustering.
- Agglomerative Hierarchical Clustering
- Divisive Hierarchical Clustering
Agglomerative Clustering
This algorithm works by grouping the data one by one on the basis of the nearest distance measure of all the pairwise distance between the data point. Structure of Agglomerative Clustering that is more informative than the unstructured set of clusters returned by flat clustering. In this clustering algorithm does not require us to prespecify the number of clusters value.
There are many available methods to form a group of data.
- single-nearest distance or single linkage.
- complete-farthest distance or complete linkage.
- average-average distance or average linkage.
- centroid distance.
- ward’s method – the sum of squared Euclidean distance is minimized.
This is the way we groping the data until one cluster is formed. With the help of using the dendrogram, we calculate how many number of clusters will be formed.
Following are step to for Agglomerative Hierarchical Clustering
- Suppose given data X = {x1, x2, x3, …, xn}
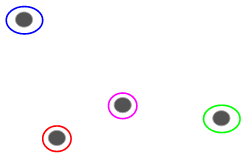
- Start with the disjoint all data point as clustering having level L(0) = 0 and sequence number m = 0. Suppose we have the following data to form clusters now in this step we assign each and every data point as a cluster.
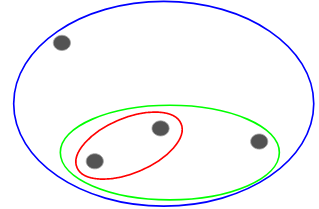
- Find the minimum distance pair of clusters in the current cluster point, say pair (r), (s), according to d[(r),(s)] = min d[(i),(j)] where the minimum is over all pairs of clusters in the current clustering this process is repeated till one cluster will be formed.
3) Form Dengrogram according to the data point. Like in the below graph there is form a dendrogram according to the nearest cluster point. It joint one by one.
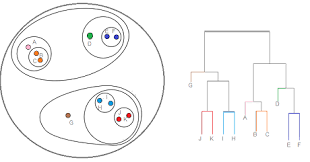
As compare to above there is suppose B & C are the first nearest distance point then A is closer to B & C the same as this process is repeated till one cluster is formed.
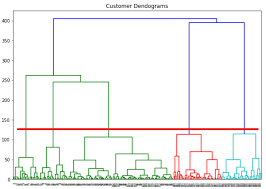
4) The next step is to determine the number of clusters so here in the dendrogram, The x-axis consists of the data point and the y-axis consists of the Euclidean distance between the clusters which formed. now we lock for the largest vertical line without crossing any horizontal line and this one is a red-framed line on the below diagram then count the number of vertical line passes on this red line that is the number of clusters. The number of clusters in this given data is 5.
Widget not in any sidebars
Divisive Hierarchical Clustering
Divisive hierarchical clustering is works in the opposite as the agglomerative hierarchical clustering. In this method top to down approach. In this process top to down method first convert all data set as the one cluster and the repeat process till each data point assign as a separate cluster.
Step one at the beginning it forms all data point as one cluster just like below graph.

Till one cluster as each data point.
Here we divide cluster separately hence the name is divisive hierarchical clustering.
Agglomerative hierarchical clustering is widely used in the industry so will focus on that algorithm in the blog.
Implementation Of agglomerative hierarchical clustering.
# import required Libraries
import numpy as np
import pandas as pd
from pandas import Series, DataFrame
import matplotlib.pyplot as plt
import seaborn as sns
import warnings
warnings.filterwarnings('ignore')
# Load DataSet
data = pd.read_csv('Wholesale customers.csv')
data.head()
| Channel | Region | Fresh | Milk | Grocery | Frozen | Detergents_Paper | Delicassen | |
| 0 | 2 | 3 | 12669 | 9656 | 7561 | 214 | 2674 | 1338 |
| 1 | 2 | 3 | 7057 | 9810 | 9568 | 1762 | 3293 | 1776 |
| 2 | 2 | 3 | 6353 | 8808 | 7684 | 2405 | 3516 | 7844 |
| 3 | 1 | 3 | 13265 | 1196 | 4221 | 6404 | 507 | 1788 |
| 4 | 2 | 3 | 22615 | 5410 | 7198 | 3915 | 1777 | 5185 |
Widget not in any sidebars
# Calculate info and describe of data
data.info()
<class 'pandas.core.frame.DataFrame'>
RangeIndex: 440 entries, 0 to 439
Data columns (total 8 columns):
Channel             440 non-null int64
Region              440 non-null int64
Fresh               440 non-null int64
Milk                440 non-null int64
Grocery             440 non-null int64
Frozen              440 non-null int64
Detergents_Paper    440 non-null int64
Delicassen          440 non-null int64
dtypes: int64(8)
memory usage: 27.6 KB
| Channel | Region | Fresh | Milk | Grocery | Frozen | Detergents_Paper | Delicassen | |
| count | 440.000000 | 440.000000 | 440.000000 | 440.000000 | 440.000000 | 440.000000 | 440.000000 | 440.000000 |
| mean | 1.322727 | 2.543182 | 12000.297727 | 5796.265909 | 7951.277273 | 3071.931818 | 2881.493182 | 1524.870455 |
| std | 0.468052 | 0.774272 | 12647.328865 | 7380.377175 | 9503.162829 | 4854.673333 | 4767.854448 | 2820.105937 |
| min | 1.000000 | 1.000000 | 3.000000 | 55.000000 | 3.000000 | 25.000000 | 3.000000 | 3.000000 |
| 25% | 1.000000 | 2.000000 | 3127.750000 | 1533.000000 | 2153.000000 | 742.250000 | 256.750000 | 408.250000 |
| 50% | 1.000000 | 3.000000 | 8504.000000 | 3627.000000 | 4755.500000 | 1526.000000 | 816.500000 | 965.500000 |
| 75% | 2.000000 | 3.000000 | 16933.750000 | 7190.250000 | 10655.750000 | 3554.250000 | 3922.000000 | 1820.250000 |
| max | 2.000000 | 3.000000 | 112151.000000 | 73498.000000 | 92780.000000 | 60869.000000 | 40827.000000 | 47943.000000 |
# perform data preprocessing
# Apply standard scalar for  feature scaling

from sklearn.preprocessing import StandardScaler
sc = StandardScaler()
sc_data = sc.fit_transform(data)
# To draw dentrogram load library

import scipy.cluster.hierarchy as sch

# Pass data into dendrogram function
plt.figure(figsize=(10,8))
dendrogram = sch.dendrogram(sch.linkage(sc_data,method='ward'))
plt.title('Dendrogram')
plt.xlabel('Customers')
plt.ylabel('Euclidean Distances')
plt.show()

#Fitting Hierarchical Clustering to the Dataset
from sklearn.cluster import AgglomerativeClustering
hc = AgglomerativeClustering(n_clusters=2,affinity='euclidean',
                             linkage='ward')

# Get Prediction nad evaluate model
y_hc = hc.fit_predict(sc_data)
# Evaluate the model
from sklearn.metrics import silhouette_score
silhouette_score(sc_data, y_hc) * 100

# let set the thereshold value 30 to cut the graph
plt.figure(figsize=(10, 7))
plt.title("Dendrograms")
dend = sch.dendrogram(sch.linkage(sc_data, method='ward'))
plt.axhline(y=30, color='r', linestyle='--')
plt.show()
Conclusion
In this blog, you will get the better understanding of hierarchical clustering and their approach to how to solve the clustering problem with the help of using hierarchical clustering.

