Power BI vs Tableau: Which Tool Should You Learn in 2026?
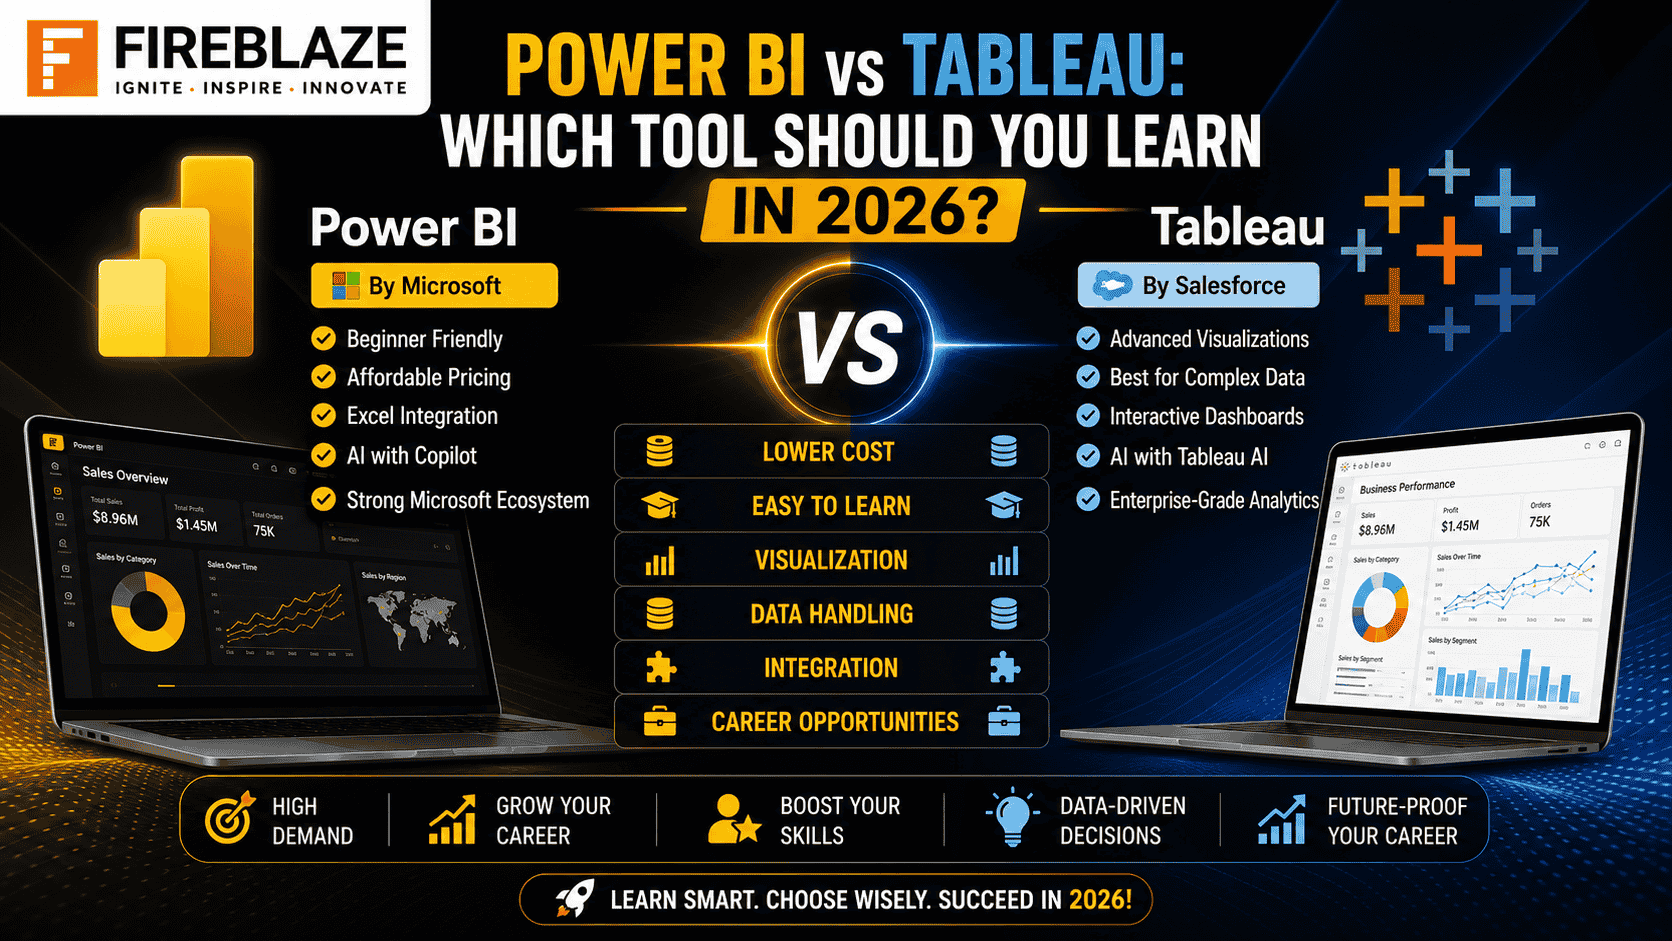
Power BI vs Tableau: Which Tool Should You Learn in 2026?
Business Intelligence (BI) tools have become essential for organizations looking to transform raw data into meaningful insights. Among the many BI platforms available today, Power BI and Tableau dominate the market. Both are powerful tools used for data visualization, dashboard creation, business reporting, and advanced analytics.
If you're planning a career in Data Analytics, Business Intelligence, or Data Science, one common question is: Should you learn Power BI or Tableau in 2026?
This guide compares both tools across features, pricing, ease of learning, AI capabilities, job opportunities, and more to help you make the right choice.
What is Power BI?
Power BI is Microsoft's Business Intelligence platform that enables users to connect to multiple data sources, clean data, create interactive dashboards, generate reports, and share insights across an organization. It integrates seamlessly with Microsoft products like Excel, Azure, SQL Server, and Microsoft Fabric.
Key Features
- Interactive Dashboards
- Data Visualization
- Power Query
- DAX Calculations
- AI Insights
- Real-Time Analytics
- Microsoft Ecosystem Integration
- Cloud & On-Premises Deployment
What is Tableau?
Tableau is a leading data visualization and analytics platform known for its highly interactive dashboards and advanced visual storytelling capabilities. It connects to a wide range of data sources and is widely used by enterprises for business intelligence and analytics.
Key Features
- Drag-and-Drop Dashboard Creation
- Advanced Data Visualization
- Interactive Storytelling
- Live Data Connectivity
- AI-Powered Analytics
- Predictive Insights
- Cross-Platform Support
Power BI vs Tableau: Feature Comparison
| Feature | Power BI | Tableau |
|---|---|---|
| Developer | Microsoft | Salesforce |
| Ease of Learning | ⭐⭐⭐⭐⭐ | ⭐⭐⭐⭐ |
| Dashboard Design | Excellent | Outstanding |
| Data Visualization | Excellent | Best in Class |
| AI Features | Strong (Copilot, AI Visuals) | Strong (Tableau AI) |
| Pricing | Affordable | Expensive |
| Excel Integration | Excellent | Good |
| Big Data Handling | Good | Excellent |
| Custom Visuals | Yes | Yes |
| Mobile Support | Yes | Yes |
| Cloud Deployment | Yes | Yes |
| Enterprise Adoption | Very High | Very High |
Ease of Learning
Power BI
Power BI is generally easier for beginners. Its familiar interface and seamless integration with Excel make it an ideal choice for students, freshers, and professionals already working in the Microsoft ecosystem.
Best For:
- Beginners
- Data Analysts
- Excel Users
- Business Analysts
Tableau
Tableau has a steeper learning curve but offers unmatched flexibility and visualization capabilities. It is preferred by professionals working with complex datasets and enterprise-level analytics.
Best For:
- Experienced Analysts
- Data Scientists
- Enterprise BI Teams
Data Visualization Comparison
When it comes to visual storytelling, Tableau has a slight edge over Power BI. It offers more customization options, smoother interactions, and advanced visual analytics.
Power BI Strengths
- Interactive Dashboards
- KPI Reports
- Business Reporting
- Financial Dashboards
Tableau Strengths
- Advanced Charts
- Storytelling Dashboards
- Geospatial Visualizations
- Custom Visual Analytics
Winner: Tableau
Pricing Comparison
Power BI
- Free Desktop Version
- Affordable Pro License
- Enterprise-Friendly Pricing
Tableau
- Free Public Version
- Higher Licensing Cost
- Premium Enterprise Features
Winner: Power BI
AI and Automation Features
Both platforms have embraced Artificial Intelligence to simplify analytics.
Power BI AI Features
- Microsoft Copilot
- Natural Language Queries
- AI Visuals
- Automated Insights
- Forecasting
Tableau AI Features
- Tableau AI
- Explain Data
- Ask Data
- Predictive Analytics
- Smart Recommendations
Winner: Tie
Performance with Large Datasets
Power BI performs exceptionally well for medium-sized datasets and integrates efficiently with Microsoft Fabric and Azure.
Tableau excels at handling very large datasets, making it a preferred choice for enterprise analytics and big data environments.
Winner: Tableau
Integration with Other Tools
Power BI
- Excel
- SQL Server
- Azure
- Microsoft Teams
- SharePoint
- Microsoft Fabric
Tableau
- Google BigQuery
- Snowflake
- AWS
- Salesforce
- Oracle
- SAP
Career Opportunities
Learning either tool can open doors to high-paying jobs in data analytics and business intelligence.
Popular job roles include:
- Data Analyst
- Business Intelligence Analyst
- Power BI Developer
- Tableau Developer
- Data Visualization Specialist
- Business Analyst
- Analytics Consultant
- Reporting Analyst
Salary Comparison in India (2026)
| Role | Average Salary |
|---|---|
| Power BI Developer | ₹6–15 LPA |
| Tableau Developer | ₹7–18 LPA |
| BI Analyst | ₹8–20 LPA |
| Senior BI Consultant | ₹20–40+ LPA |
Note: Salaries vary based on experience, skills, company, and location.
Which Tool Should Beginners Learn?
Choose Power BI if you:
- Are a beginner
- Already use Microsoft Excel
- Want a quicker learning curve
- Need an affordable BI solution
- Aim for Data Analyst roles
Choose Tableau if you:
- Want advanced visualizations
- Work with enterprise-scale data
- Prefer highly interactive dashboards
- Target Data Visualization or Analytics Consultant roles
Should You Learn Both?
Yes. Many companies use both Power BI and Tableau depending on their business requirements. Learning Power BI first builds a solid foundation in business intelligence, while Tableau enhances your ability to create sophisticated visualizations and enterprise dashboards. Professionals who are proficient in both tools often have a competitive edge in the job market.
Final Verdict
| Category | Winner |
|---|---|
| Ease of Learning | ✅ Power BI |
| Pricing | ✅ Power BI |
| Excel Integration | ✅ Power BI |
| Advanced Visualization | ✅ Tableau |
| Large Data Handling | ✅ Tableau |
| Enterprise Analytics | ✅ Tableau |
| Beginner Friendly | ✅ Power BI |
| Overall Career Value | ✅ Learn Both |
Conclusion
Power BI and Tableau are two of the most in-demand business intelligence tools in 2026, and each offers unique advantages. If you're just starting your career in data analytics, Power BI is the better choice due to its affordability, ease of use, and seamless Microsoft integration. If your goal is to master advanced data visualization and enterprise-level analytics, Tableau is an excellent investment. Ultimately, learning both tools will maximize your career opportunities and make you a versatile BI professional capable of handling a wide range of analytics and reporting projects.