
")

Table of Contents
Introduction to Excel vs Tableau
In This Article, We Are Going To Discuss Excel vs Tableau Which one is Best. Data Visualization has taken over the big data industry. It is the art of inferring insights through the help of interactive dashboards and graphs. The pictorial representation of data enables decision-makers to understand heavy concepts and uncover new patterns. Human beings understand things that are visually well descriptive and interesting. It is, without a doubt, the best investment for any business venture. It can help enterprises in –
- Predicting sales and factors of profit
- Identify problem areas
- Study characteristics that influence their users
- Understand product behavior
While searching for a suitable data visualization tool, companies are often faced with a stalemate. They have to choose between the reliable, well-established Excel or the steadily increasing, fancy Tableau. Excel spreadsheets have stood the challenge of time and continue to be used in every industry. Tableau, on the other hand, is making its mark as a data visualization giant. So Lets See Who Will Win Excel vs Tableau.
So which one does your company need? Which tool should you specialize in to boost your resume? This article puts forward in plain sight the features both applications have to offer.
Widget not in any sidebars
Microsoft Excel
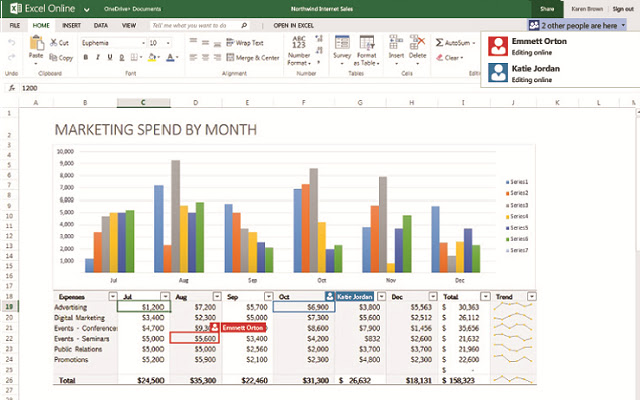
Excel is popular as a spreadsheet application. It is used to filter, query and find quick insights from data. However, Excel does have data visualization capabilities as well. It is full of data analysis operations like charts, pivot tables, slicers, sparklines and more. Excel is outstanding in creating quick visualizations. But since data is stored in a tabular format, most professionals know it as a data representation tool.
Data in a spreadsheet tool like Excel is represented in rows and columns and the data is fed into the cells. Manipulation with the data can be performed by built-in formulas or writing macros (set of customized actions to perform on data). This data can be visualized with the help of charts and pivot tables.
Salient features of Excel
- Useful for data manipulations and statistics
- Ease of making quick one-off reports
- If a user is skilled in VB scripting, they can make full-fledged use of Excel
- Best applicable for small-scale, structured data.
- It has steadily picked up pace as a visualization tool. It performs faster analysis and supports data from multiple sources.
- Compatible with other Microsoft products.
- Preferred due to its popularity and the familiarity it offers.
Challenges in Excel
- Dealing with unstructured data is cumbersome. Excel also renders useless with data formats like JSON which is one of the most sought-after datatypes in developing hybrid websites and mobile applications.
- The dearth of functionality to create visually appealing dashboards.
- Inability to update data in real-time. This makes Excel useless in analyzing streaming data.
- Doesn’t offer collaboration.
Tableau
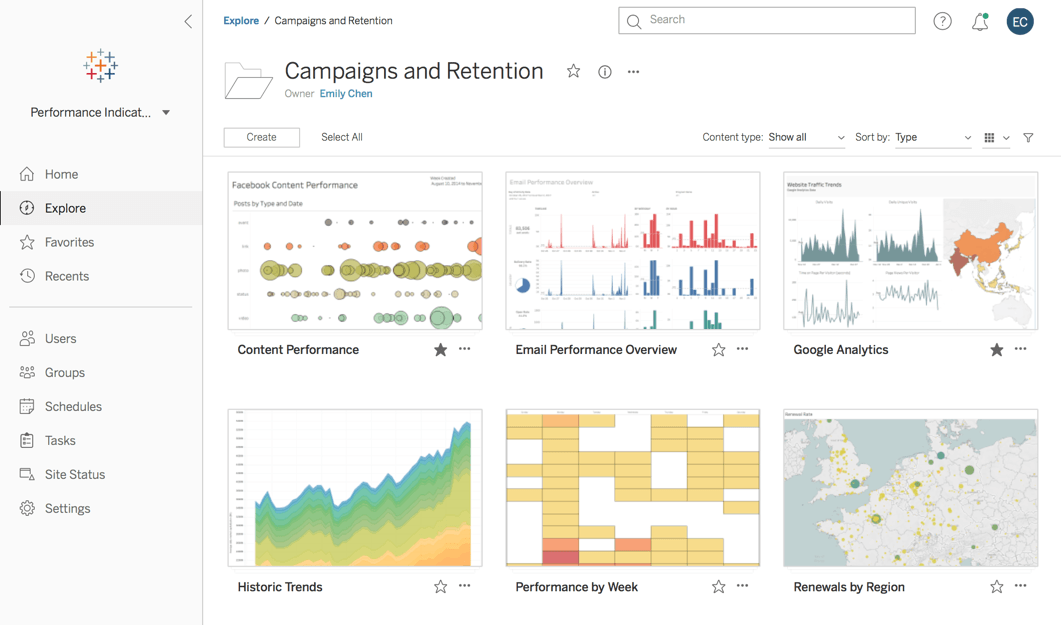
Tableau is a stalwart and fast-evolving data visualization application used in the Business Intelligence Industry. It helps in making raw data useful through pictorial and graphical representations. Tableau helps create visualizations that can be understood by professionals at any level of the organization’s hierarchy. It also allows non-technical users to create customized dashboards.
Tableau software enables the connection and extraction of data stored in various places. It can inject data from any platform and source including the most preferred ones like Excel, PDF, Oracle, or even Amazon Web Services. The USP of Tableau is that it doesn’t require any technical or any kind of programming skills to operate. It has garnered interest among people from all domains such as business, researchers, academics, etc.

Salient features of Tableau –
- Fantastic visualizations with interactive dashboards and story-telling charts.
- In-depth insights to deliver on specific goals
- Ability to work with multiple data sources and real-time data.
- Quick processing capabilities
- User-friendly interface that provides collaboration functionality.
Challenges with Tableau
- Due to its increasing popularity, Tableau no longer provides flexible pricing and is expensive in the long run.
- Doesn’t provide functionalities for full-scale reporting
- Limited features for data cleaning and preprocessing.
Widget not in any sidebars
Comparison by features
| Feature | Excel | Tableau |
| Invention purpose | A Data representation tool. Excel software is used to format, organize, and calculate the data. | A Data visualization tool. Tableau Software to visualize and represent the useful insights from the raw data. |
| Business purpose | Quick creation of basic charts and one-off reports | Charts and dashboards created to generate insights from raw data. |
| Data Sources | Now supports data from multiple sources. But needs to be updated periodically with the help of macros | Automated ingestion of real-time data is allowed. |
| Visualizations | Allows the creation of only basic charts and pivot tables. | Offers a wide array of charts to choose from and the ability to create interactive dashboards |
| Formatting data | Manipulation of data is easier with Excel | Doesn’t allow data manipulation |
| Used By | Data analysts and other professionals. Can make the best use of excel if skilled in macros and scripting (VB). | Business analysts. Programming skills are not mandatory. |
| Volume | Unable to deal with large data | Easily used for big data applications and streaming data. |
| Suitable for | Performing complex calculations on data, manipulation and transforming data | Generating insights with appealing graphs and insightful dashboards. |
| Industry | Best applicable with businesses that deal with small volumes of data that is structured | Useful for industries that need data-driven solutions to thrive |
Conclusion
We have discussed the merits and demerits of both of these popular visualization tools. It is also important to note the following while choosing amongst them –
- The need for generating reports
- Budget for a data visualization tool
- Whether dashboards are necessary for your business
Excel continues to be a favorite when it comes to data storage and manipulation. It is a robust tool serving the functionality of report creation, chart creation and drilling down on data. Tableau recognizes the need for Excel in businesses and offers connections to Excel data sources. Use Tableau to create stunning visualization and Excel for easier cell formatting. If a company already incorporates the Microsoft package, make sure to leverage MS Excel to the fullest. Tableau offers powerful dashboards and a myriad of plotting graphs to strengthen Business Intelligence in any enterprise.
Data Analysts in the making should definitely have skills in both of these applications. Knowing your company’s needs will help you choose the tool of choice. So What Your Thoughts on Excel vs Tableau


Nice article with the most useful Information.
https://www.gologica.com/course/tableau/
Thanks for sharing such a great Information! Waiting for more updates like this.
https://www.gologica.com/course/tableau/