Table of Contents
Introduction to Interview Questions on Data Science
In this article we are going to discuss mostly asked Interview Questions on Data Science. Data scientists are seeing a huge rise in opportunities as more and more companies continue to leverage big data for data-driven business outcomes. They are in the forefront of this demand as it improves the way a business is able to handle customers, run operations and optimize their products. However, data science is a very vast field, and it may be increasingly tough to crack interviews. In addition to knowing various machine learning models, one must also be adept in advanced statistics and handling data.
Here, we have compiled some important questions in each data science domain. Hope this list helps you understand the kind of questions you can expect in an Interview Questions on Data Science.
Probability and Statistics questionnaire
Q) How to select metrics?
The technique to choose the right metric to evaluate the model is determined by the following factors –
1. What kind of machine learning method is used – classification, regression, etc.
2. How is the target variable distributed?
3. Whether precision or recall needs to be achieved.
Some methods for calculating metrics include RMSE, RMAE, F1 score, accuracy, precision, etc.
Q) What is a confusion matrix?
Confusion matrix is a technique used to determine the accuracy and performance of a classifier model. It is a 2×2 matrix that segregates outputs of a binary classifier. When run on the test data, the classifier model returns its own output. This is then compared with the actual values.
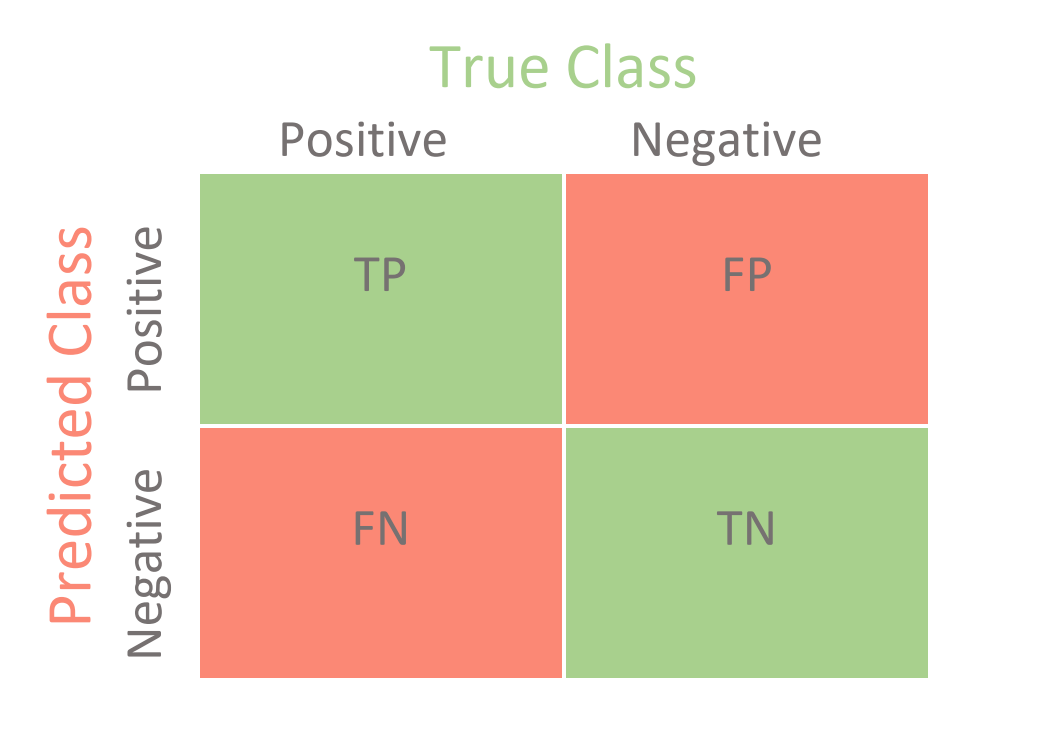
TP – True positive or the correct positive prediction
TN – True negative or the correct negative prediction
FN – False negative or the incorrect negative prediction
FP – False positive or the incorrect positive prediction
The following metrics can be derived from the values in a confusion matrix.
| Metric | Formula |
| Accuracy | (TP+TN)/(P+N) |
| Error Rate | (FP+FN)/(P+N) |
| Sensitivity (Recall) | TP/P |
| Precision | TP/(TP+FP) |
| Specificity | TN/N |
Q) What are p-values?
P-values are used to determine the accuracy of the hypothesis on which the model is based. P-value is between 0 and 1.
Low p-value (≤ 0.05) indicates strenght against the null hypothesis, thus can be rejected. High p-value shows that the null hypothesis is valid and can thus be used. The lower p-values are in the tail-ends of a normally distributed dataset.


Q) Explain ROC curve.
An ROC curve is a graph used to determine the accuracy of a classification model. It plots the true positive rate and the false positive rate. It is used to visualize the sensitivity of the classifier.
Q) Explain the different kinds of biases that occur.
Bias occurs when the sample data is not enough to properly study the population. In data science, we usually deal with the following biases –
- Selection bias – Here, the error is introduced due to a non-random population sample i.e sample obtained is not representative of the population.
- Undercoverage bias – This is a kind of bias that occurs when certain aspects of the population are not adequately represented in a sample.
- Survival bias – This happens when we concentrate only on the characteristics that made it past the selection process of a sample and completely overlook those that were not selected. It can lead to false conclusions.
Thinking to learn Data Science? Get placed with our job oriented Data Science & Machine Learning Program. Click to know more.
Q) What is a normal distribution?
A normal distribution is derived from the notion that random variables are distributed in the form of a symmetrical, bell-shaped curve i.e data is distributed around a central value.

Characteristics of a normal distribution –
- Mean, median, mode are almost identical and are located in the distribution’s center.
- The distribution is symmetrical.
- It has no bias towards left or right.
Q) Explain precision, recall, and F1 score.
Precision is the ratio of relevant observations out of total positive observations.
Precision = TP/(TP+FP)
Whereas, recall is the proportion of relevant positives that were identified correctly.
Recall = TP/(TP+FN)
F1 score is measured to balance the recall and the precision. A high F1 score indicates good precision and recall. i.e it indicates that there are low false positives and false negatives.
Q) Importance of covariance and correlation
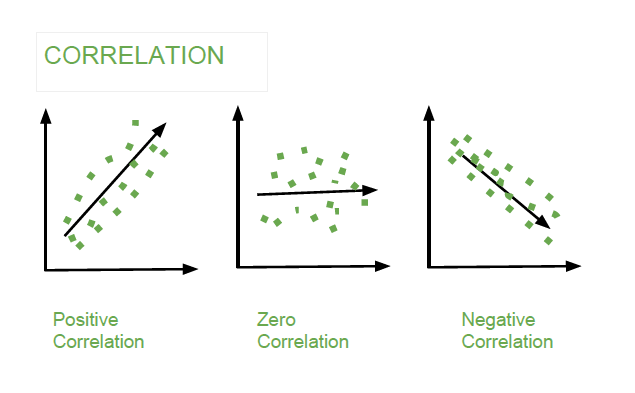
Covariance and correlation are used to determine the relationship and degree of measure between two variables.
Correlation – Measures how strongly two variables are related.
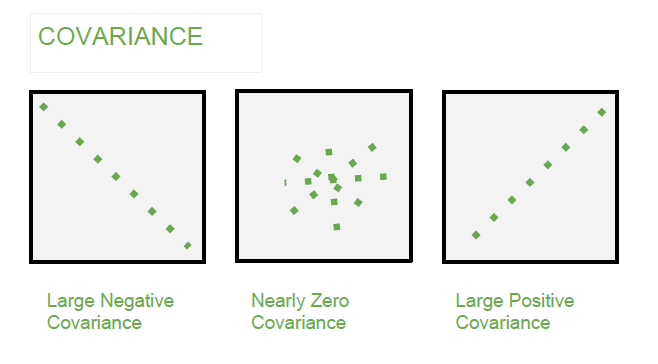
Covariance – It is a statistical tool used to indicate the relationship between the movement of two variables.
Data Analysis & Preprocessing Questionnaire
Q) Importance of data wrangling.
Data wrangling helps in making data useful by transforming it to make it compatible to the model. It is necessary because –
- Helps to increase the accuracy and performance of the model.
- Makes it easier to work with, especially when data is from disparate sources of different formats.
- Handling null values and normalizing the data is important to achieve optimum model performance.
Q) What is cross-validation?
Cross-validation is a technique to evaluate how the outcomes of a statistical analysis will generalize to an independent data set. The most common implementation of cross-validation is splitting data into test and training sets. The aim of cross-validation is to limit problems like overfitting and gain insight into how the model will hypothesize to an independent data set.
Q) Explain univariate, bivariate and multivariate analysis.
| Univariate Analysis | Bivariate Analysis | Multivariate Analysis |
| Examination and study of the behaviour of one variable at a time. Summary and patterns can be determined from calculating mean, median, range, min-max etc. eg. Height of person | Bivariate analysis involves finding the relationship and pattern between two variables. Covariance and correlation are some metrics used here. eg. Impact of marketing on sales | It is the study of more than two variables to understand their effect on the target. eg. acidity, temperature, age of wine impact on wine’s quality |
Q) What is an outlier? How can they be assessed?
An outlier is a data point that differs significantly from other observations. It may be due to variability in measurement or due to experimental error. Some ways to identify outliers are –
- Z-score – If the data is normally distributed, then we can easily find the outliers after 3 standard deviations (i.e Z-score equal to ±3)
- IQR – Inter-quartile range can also be used to understand outliers by plotting boxplots.
Outliers can be treated by –
- Dropping if they are garbage values.
- Using a different model for analysis (eg. outliers in a linear model may be essential in a non-linear model)
- Normalize the data.
- Using algorithms that are not affected by outliers like Random Forest classifier.
Q) How to treat missing values?
Handling missing values depends on the attribute that holds missing values, its dependency, and whether it’s part of a large dataset. Typically, missing values are handled in the following manner –
- Assigning default values like mean, median, mode, min, max if there are no patterns identified.
- If the value is categorical, assign a default value.
- It is best to drop the variable if most of the values of an attribute are missing (> 80%),
- If the dataset is huge, then simply remove the rows containing null values.
Questions Related To Machine Learning
Q) Explain model overfitting and underfitting? How to avoid it?
Overfitting is known to occur when a model is too complex, has too many parameters relative to the dependent variable. This model has poor predictive performance, as it overreacts to minor fluctuations in the training data.
Underfitting occurs when the model is unable to determine the relationship or trend in the underlying data. It leads to bad accuracy of the model.
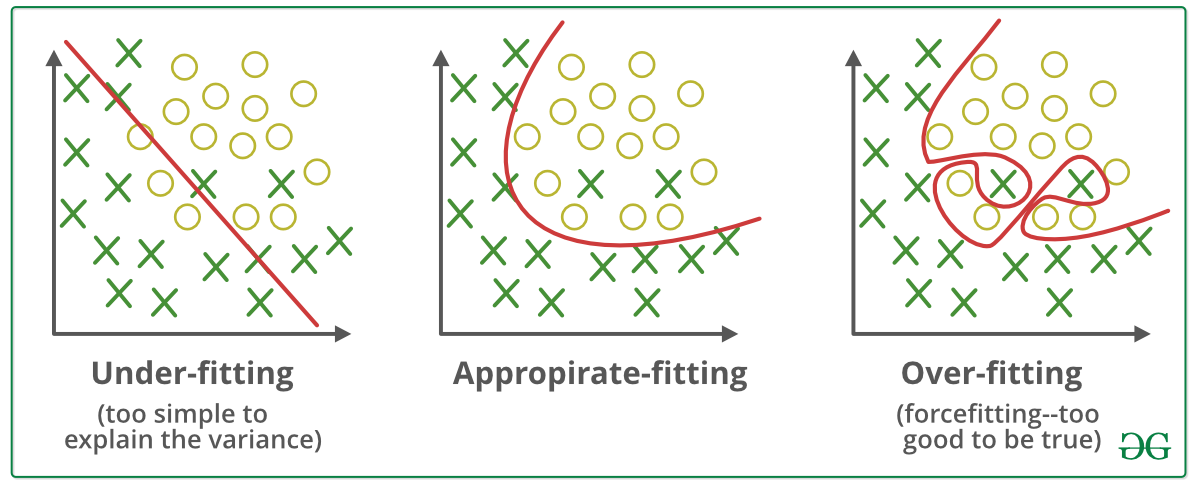
One of the ways to combat overfitting and underfitting is to resample the data and use another training set for the model. It can be measure using k-fold cross-validation.
Q) Briefly explain some important kinds of regression.
Linear regression – It is a statistical technique where a dependent variable is predicted from the score of another independent variable X. It assumes a linear relationship between two variables. Eg. Correlation between marks obtained by a student and the study hours.
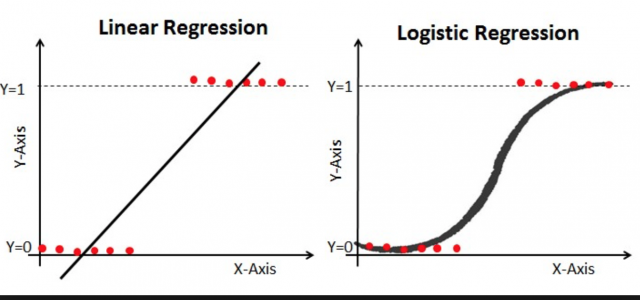
Logistic regression – It is a logistical model used to predict a binary result based on the combination of dependent variables. The outcome here is binary, but there are multiple explanatory variables to generate the outcome. Eg. age, salary, gender, credit score etc. to determine whether a loan should be given to the customer or not.
Q) Differentiate between supervised and unsupervised learning.
| Supervised Machine Learning | Unsupervised Machine Learning |
| Training done on labelled data | Training done on unlabelled data |
| Cross validation needs to be done to achieve better performance | No cross validation |
| Aim is prediction | Aim is analysis of data |
| Examples – Classification, Regression | Examples – Clustering, Density estimation, Pattern recognition |

Q) Explain SVM.
SVM stands for support vector machine. It is a supervised machine learning algorithm that can be used to implement both regression and classification. It can solve linear and non-linear problems. The fundamental idea behind SVM is simple: The algorithm creates a line or a hyperplane which separates the data into classes.
Here, the thinner lines mark the distance from the classifier to the closest data points called the support vectors (data points that have a darker border). The distance between the two thin lines is called the margin.
Q) Explain decision tree algorithm. What is entropy and information gain?
Decision trees are a popular supervised learning model, used to classify labelled data. Each square above is called a node, and the more nodes you have, the more accurate your decision tree will be. It is a decision support tool that uses a tree-like model of decisions and their possible outcomes.
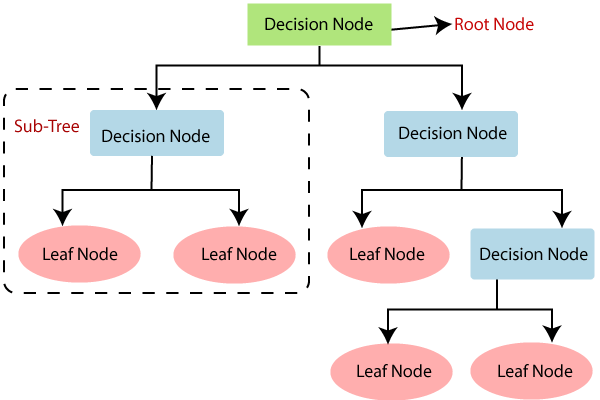
Entropy – Used to check homogeneity of a sample. If the sample is completely homogenous then entropy is 0 and if the sample can be equally divided it has an entropy of 1.
Information Gain – It is based on the decrease in entropy after a dataset is split on an attribute. While building nodes, we try to maximize the information gain.
Q) What is k-means clustering? How do you determine no. of clusters?
k–means clustering is an unsupervised learning method, that aims to partition n observations into k clusters in which each observation belongs to the cluster with the nearest mean (cluster centers or cluster centroid). The cluster is aggregated together by means of some similarities (here, distance from the cluster centroid).
The elbow method is used to find the optimum number of clusters needed for developing the model.
Q) What is bias-variance trade-off?
The aim of any supervised machine learning algorithm is to have low bias and low variance to achieve good prediction performance. Bias is the error introduced due to oversimplification of sample. Variance occurs when the machine learning model is too complex resulting in overfitting.

For instance, the k-nearest neighbor algorithm has low bias and high variance. However, the trade-off can be changed by increasing the value of k which in turn increases the bias of the model.
So with the help of this guide on Interview Questions on Data Science, you are one step closer to obtaining the data scientist job of your dreams. Make sure you’re aware of the different kinds of machine learning models and also why and how they are implemented. Recommender systems (collaborative and content-based filtering), different kinds of classifiers like Random Forest are also vital to learn about. Make your portfolio strong by developing different ML techniques and stay ahead in the Data Science learning curve! In this article, we successfully discussed the most important Interview Questions on Data Science.


